
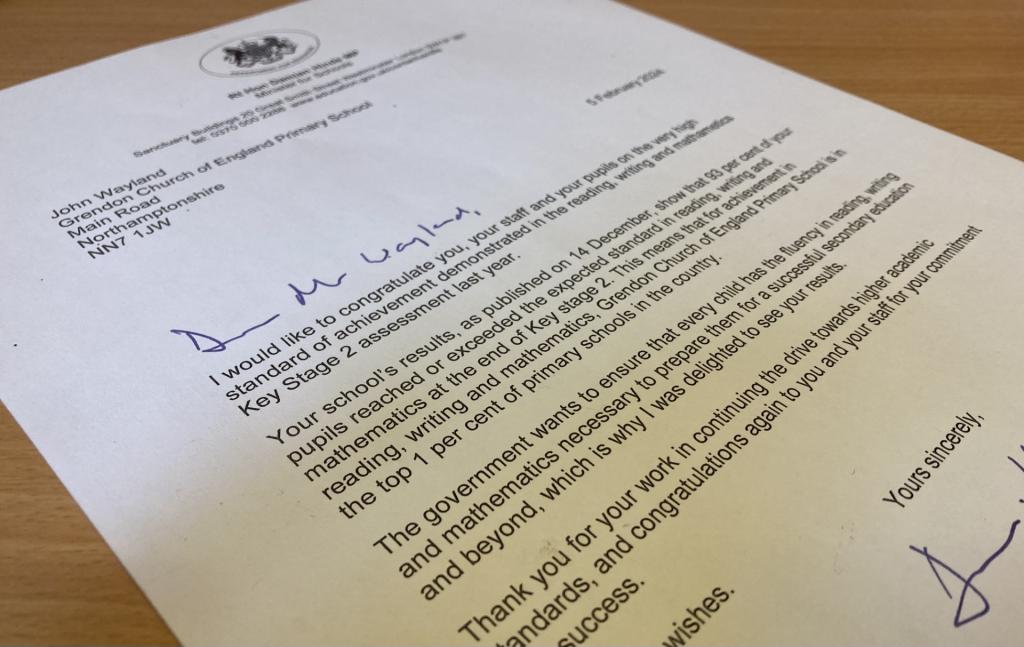
Minister For Schools Letter
In February 2024, the school received a letter from the Minister for Schools, congratulating Grendon CE Primary School on performing within the top 1% of all primary schools in the country in Key Stage 2 assessments. You can see more detail on the school's performance data below.
2025 Performance Data
Key Stage 2 - % of pupils reaching the expected standard
| National | School | Difference | |
|---|---|---|---|
| RWM combined | 62% | 80% | +18% |
| Reading | 75% | 87% | +12% |
| Writing | 72% | 87% | +15% |
| Maths | 74% | 93% | +19% |
| GPS | 73% | 80% | +7% |
Key Stage 2 - % of pupils reaching the higher standard
| National | School | Difference | |
|---|---|---|---|
| RWM combined | 8% | 20% | +12% |
| Reading | 29% | 33% | +4% |
| Writing | 13% | 40% | +27% |
| Maths | 24% | 27% | +3% |
| GPS | 32% | 40% | +8% |
Year 1 Phonics Screening Check - pass
| National | School | Difference | |
|---|---|---|---|
| 2025 | 80% | 94% | +14% |
EYFS - % of pupils achieving a Good Level of Development
| National | School | Difference | |
|---|---|---|---|
| Good Level of Development (GLD) | 75% | 86% | +11% |
2024 Performance Data
Key Stage 2 - % of pupils reaching the expected standard
| National | School | Difference | |
|---|---|---|---|
| RWM combined | 61% | 88% | +27% |
| Reading | 74% | 88% | +14% |
| Writing | 72% | 94% | +22% |
| Maths | 73% | 94% | +21% |
| GPS | 72% | 94% | +22% |
Key Stage 2 - % of pupils reaching the higher standard
| National | School | Difference | |
|---|---|---|---|
| RWM combined | 8% | 19% | +11% |
| Reading | 29% | 56% | +27% |
| Writing | 13% | 19% | +6% |
| Maths | 24% | 31% | +7% |
| GPS | 30% | 44% | +14% |
Year 1 Phonics Screening Check - pass
| National | School | Difference | |
|---|---|---|---|
| 2024 | 79% | 100% | +21% |
EYFS - % of pupils achieving a Good Level of Development
| National | School | Difference | |
|---|---|---|---|
| Good Level of Development (GLD) | 67% | 79% | +12% |
2023 Performance Data
Key Stage 2 - % of pupils reaching the expected standard
| National | School | Difference | |
|---|---|---|---|
| RWM combined | 59% | 93% | +34% |
| Reading | 73% | 100% | +27% |
| Writing | 71% | 93% | +22% |
| Maths | 73% | 93% | +20% |
| GPS | 72% | 100% | +28% |
Key Stage 2 - % of pupils reaching the higher standard
| National | School | Difference | |
|---|---|---|---|
| RWM combined | 7% | 36% | +29% |
| Reading | 28% | 71% | +43% |
| Writing | 13% | 36% | +23% |
| Maths | 23% | 50% | +27% |
| GPS | 28% | 86% | +58% |
Key Stage 1 - % of pupils reaching the expected standard
| National | School | Difference | |
|---|---|---|---|
| Reading | 68% | 80% | +12% |
| Writing | 60% | 60% | 0% |
| Maths | 70% | 93% | +23% |
Year 1 Phonics Screening Check pass
| National | School | Difference | |
|---|---|---|---|
| 2023 | 79% | 93% | +24% |
EYFS - % of pupils achieving a Good Level of Development
| National | School | Difference | |
|---|---|---|---|
| Good Level of Development (GLD) | 65% | 71% | +6% |